
How To Power Up Using ServiceNow Performance Analytics
Saurav Preet Singh
May 13, 2022
The complex business landscape requires enterprises to quickly and seamlessly identify, prioritize, and remediate threats before they become large-scale problems. But inefficient, manual processes and a widening gap between security and IT teams get in the way, leading to long detection or response times and increased risk of security breaches. Real-time visibility into performance is critical for security operations to understand business risks, increase efficiency, and respond to threats.
According to market research, The global performance analytics market size was valued at $1,568.59 million in 2018 and is projected to reach $6,506.21 million by 2026, growing at a CAGR of 19.61% from 2019 to 2026.
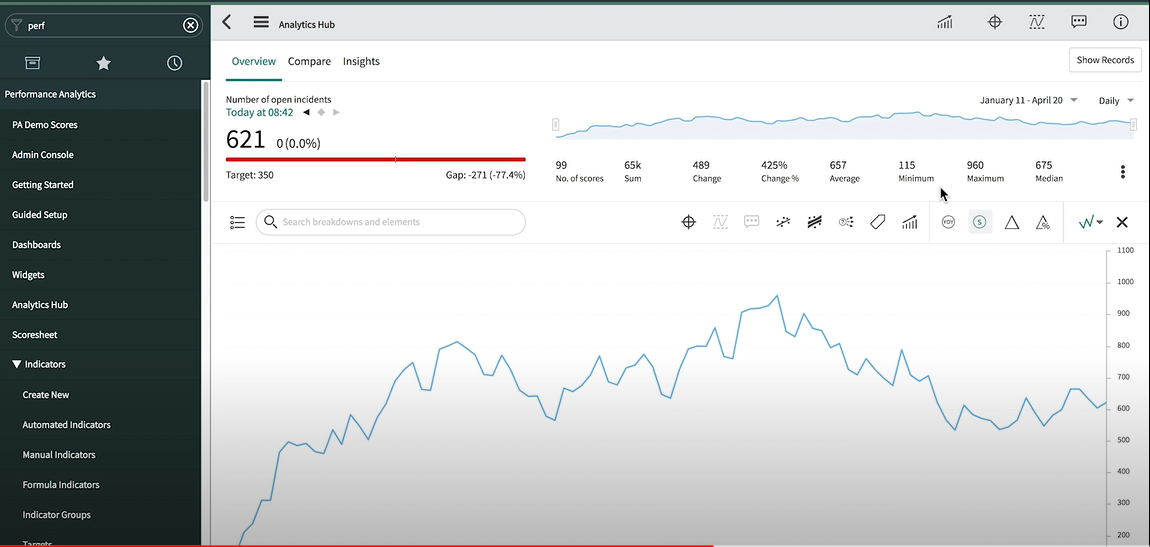
ServiceNow Performance Analytics drives business transformation by empowering businesses to set, track, and analyze progress against policies. It connects more people with better data in less time and helps them focus on essential things. ServiceNow Performance Analytics shows historical data in the form of graphs represented over a period, allowing organizations to view and analyze trends for a particular data set.
ServiceNow Performance Analytics vs Reporting
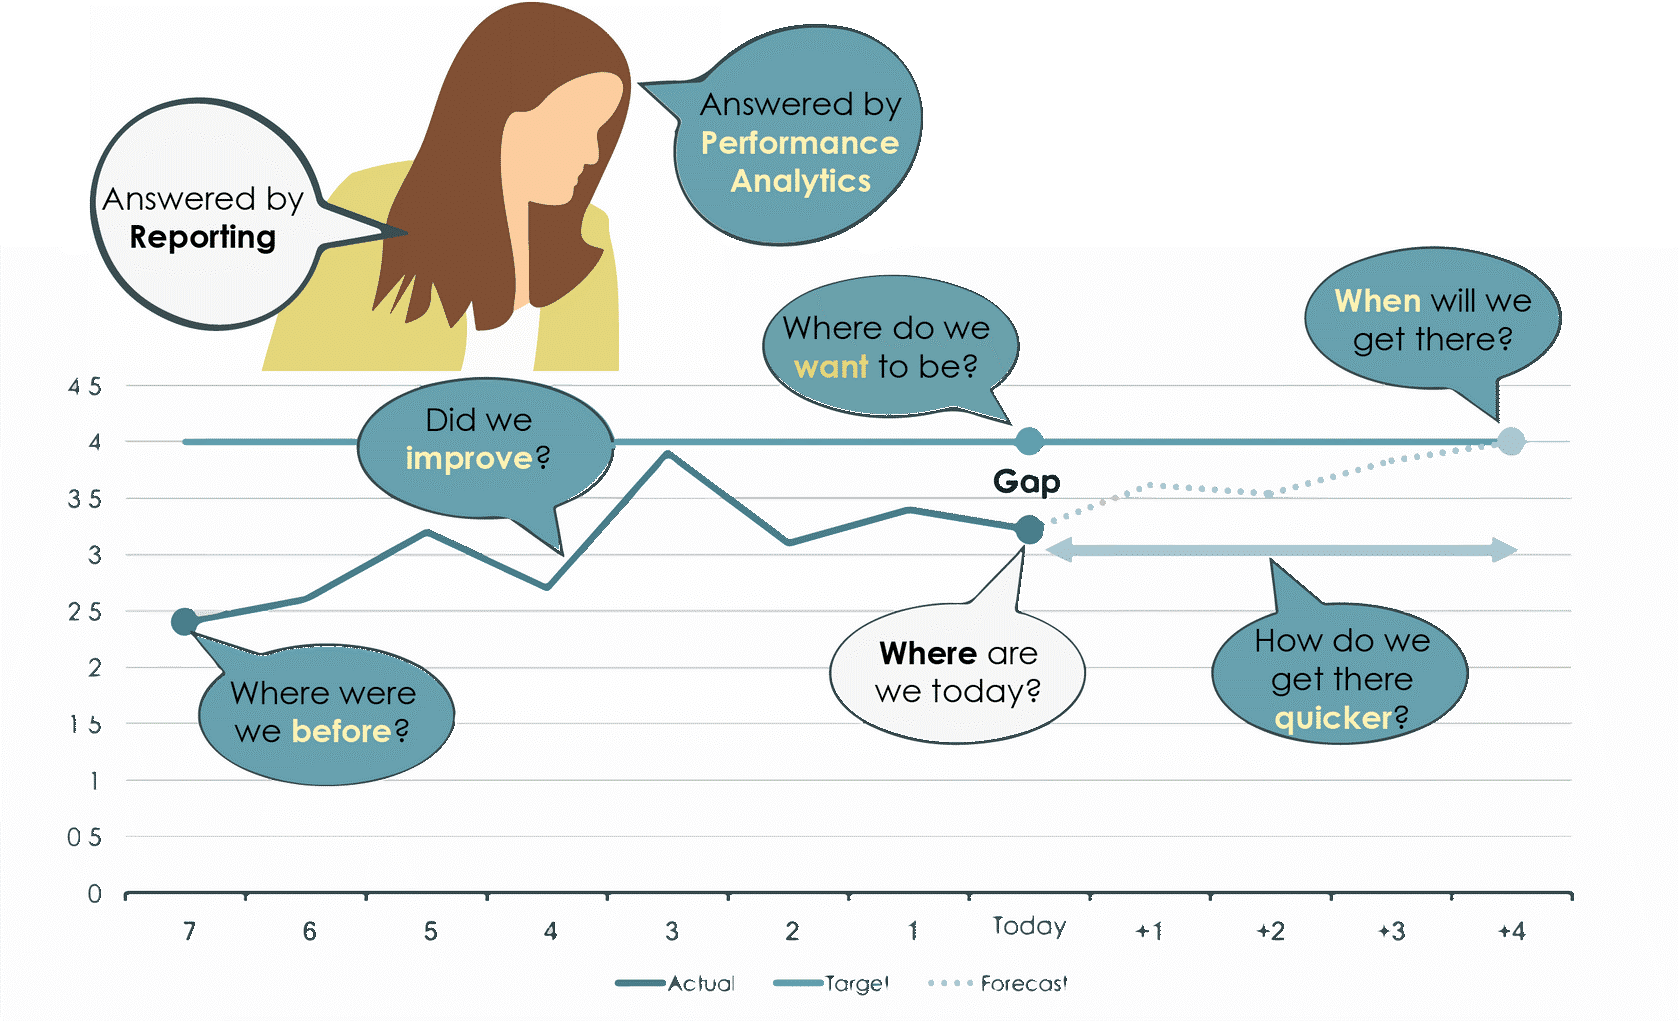
ServiceNow Performance Analytics can generate accurate historical trends by taking continuous snapshots on a regular schedule. As shown in the following diagram, reporting answers the question, “Where are we today?” Performance analytics indicates what is happening over time and predicts future forecasts.
A Look into Business Scenario
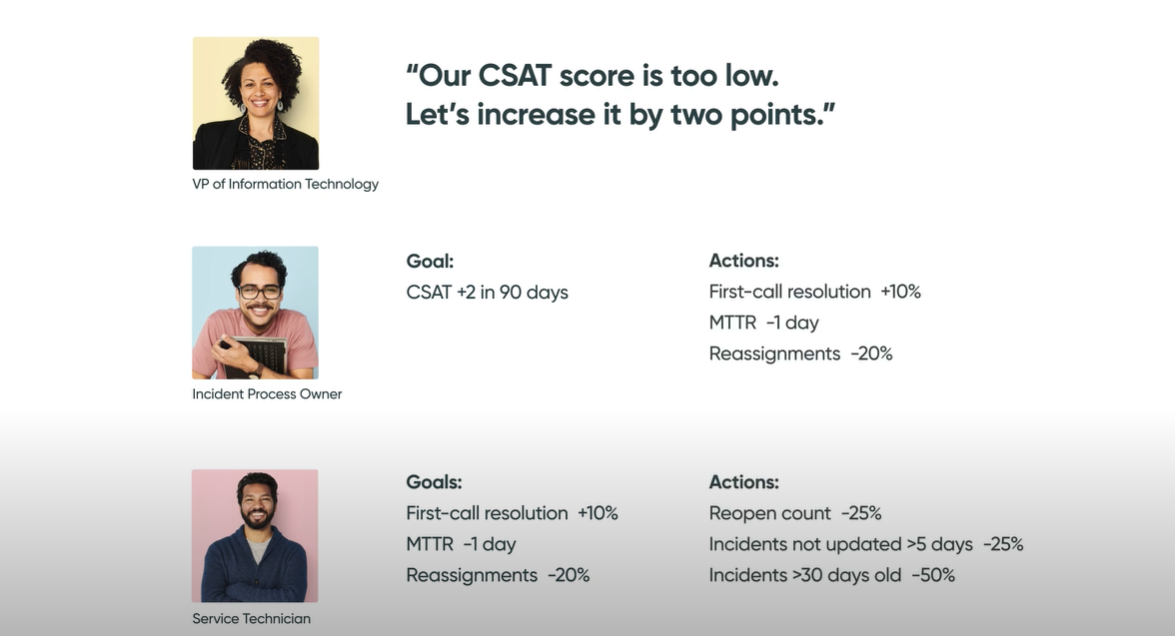
Achieving a business goal requires action by people at various levels in the company working together.

Suppose the VP of IT learns from CSAT surveys that the company’s employees are unhappy with how IT manages incidents.

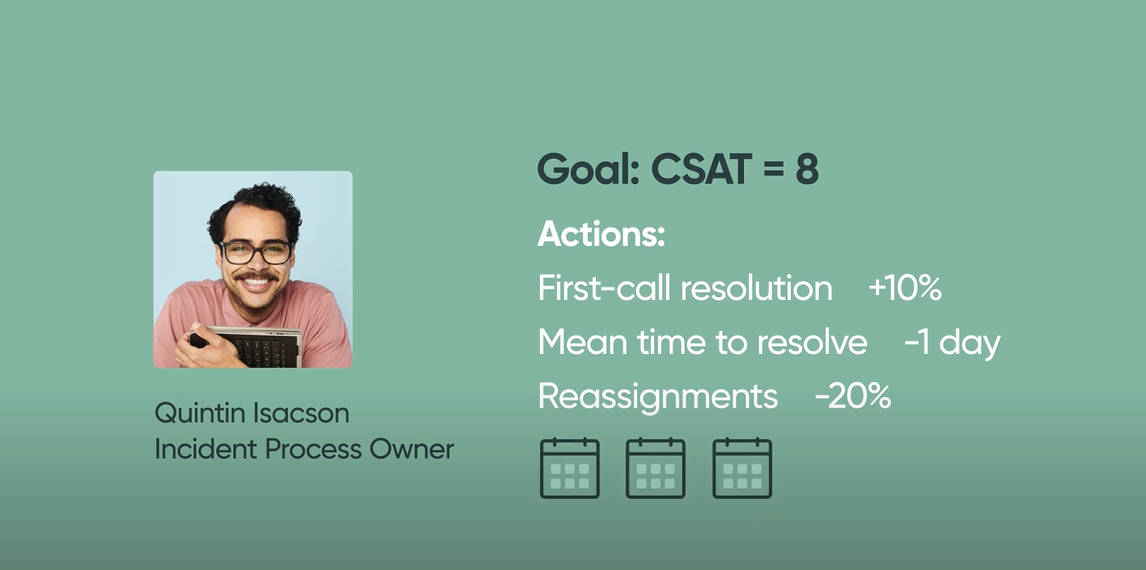
The VP sets a goal for the incident process owner to improve the CSAT for the incident process by 2 points in 90 days. Now the process owner decides on some specific actions to achieve that goal:
- Increase the first-call resolution by 10 %
- Reduce MTTR (Mean time to resolve) by one day
- Reduce reassignments by 20 %
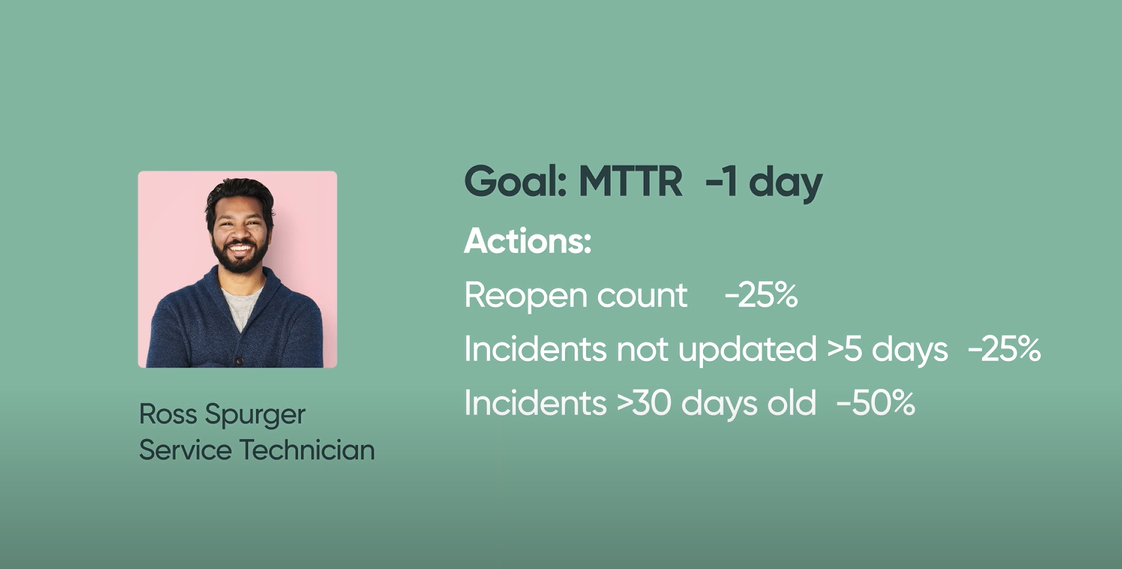
Next, the process owner meets with the service technicians who manage incidents. The actions of the process owner become the goals of the technician working on the tickets. The process owner decides the set of activities for the technician. For the goal to reduce the Mean time to resolve by one day:
- Reduce the reopen count by 25 %
- Reduce incidents not updated for more than five days by 25 %
- Reduce incidents more than 30 days old by 50 %
This whole multi-level process results in specific goals for each person at each level and specific actions for each person to achieve their goals.
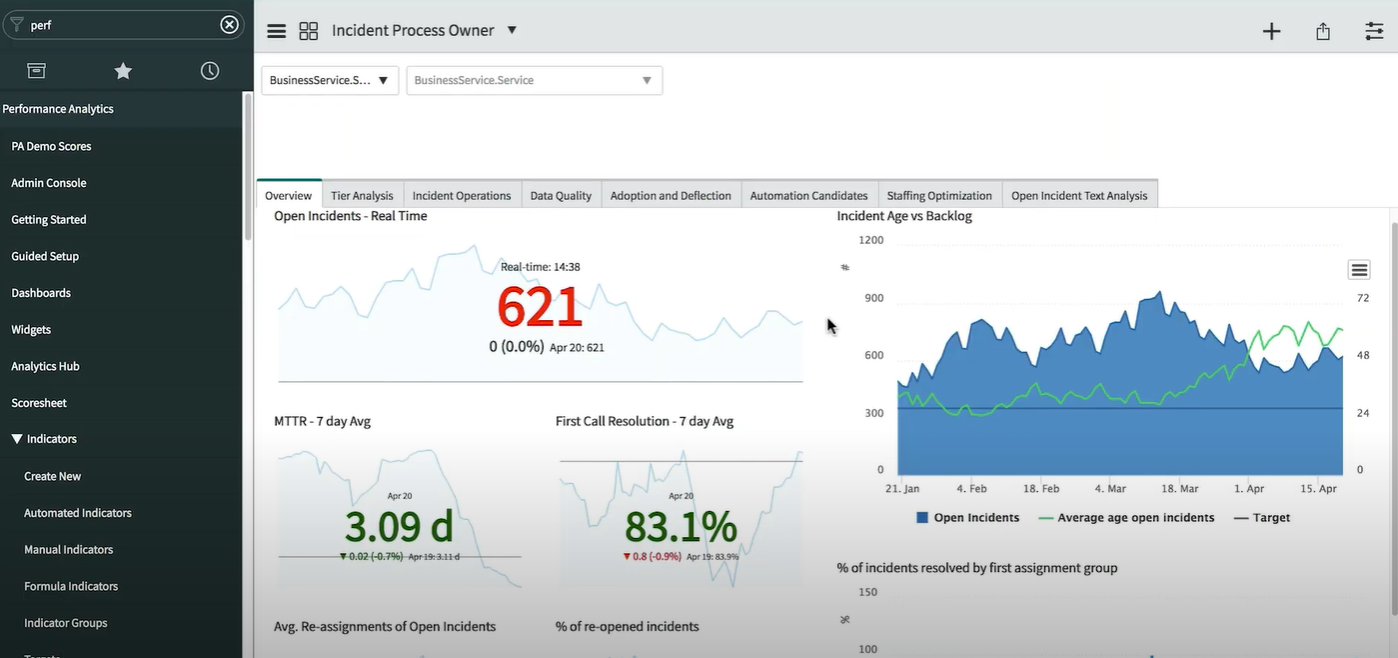
ServiceNow Performance Analytics measures the results of the actions by the people at each level over time and forecasts future performance based on those results. Delivers the correct information to each person to see how they are doing.
Key Components used in ServiceNow Performance Analytics
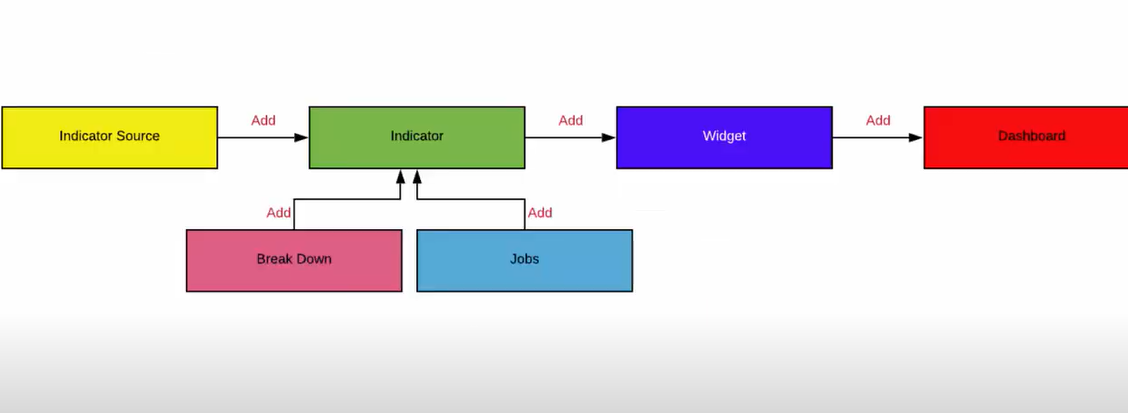
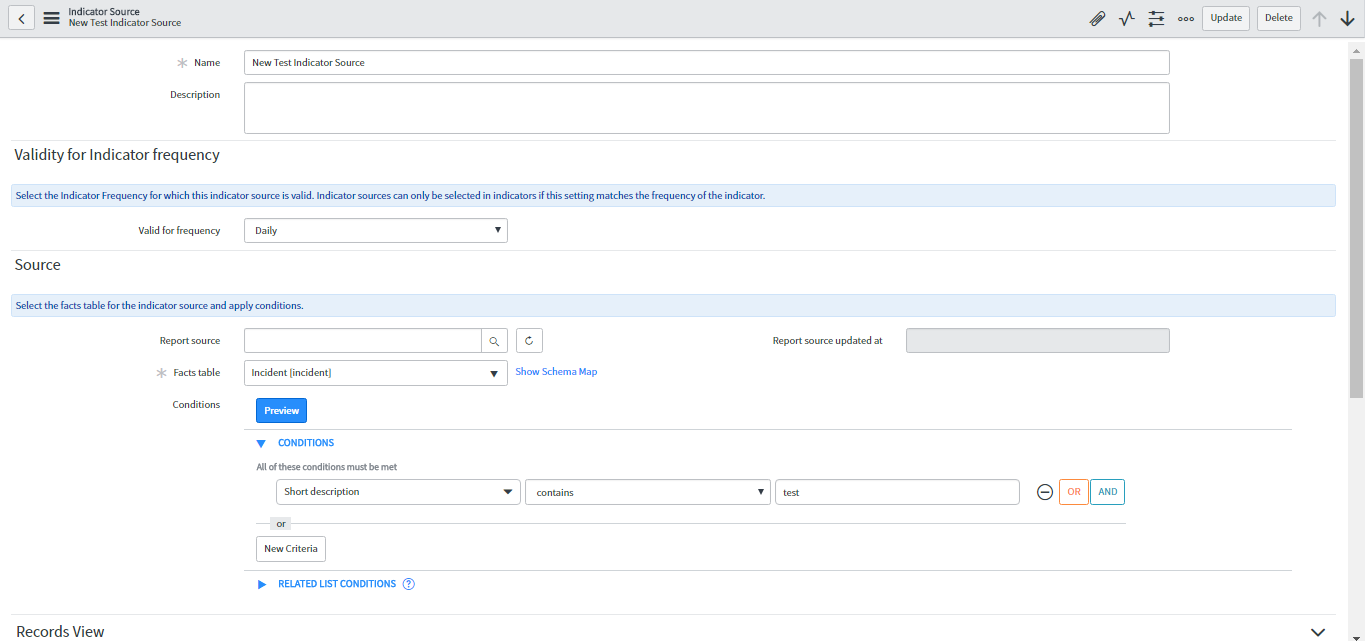
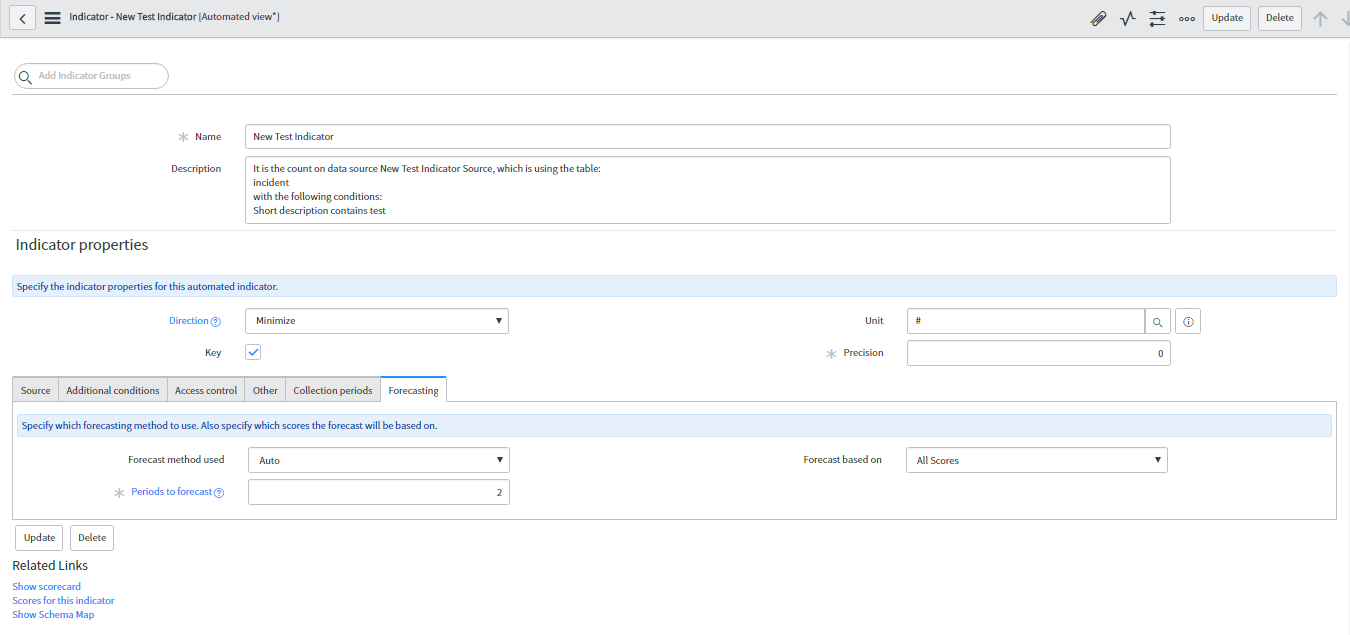
1) Indicator Source: An Indicator Source defines what records should be collected from a table in the database.
2) Indicators: Indicators or KPIs (Key performance indicators) measure specific business goals. ServiceNow Performance Analytics tracks results using indicators.
There are three types of indicators:
- Automated Indicators
- Formula Indicators
- Manual Indicators
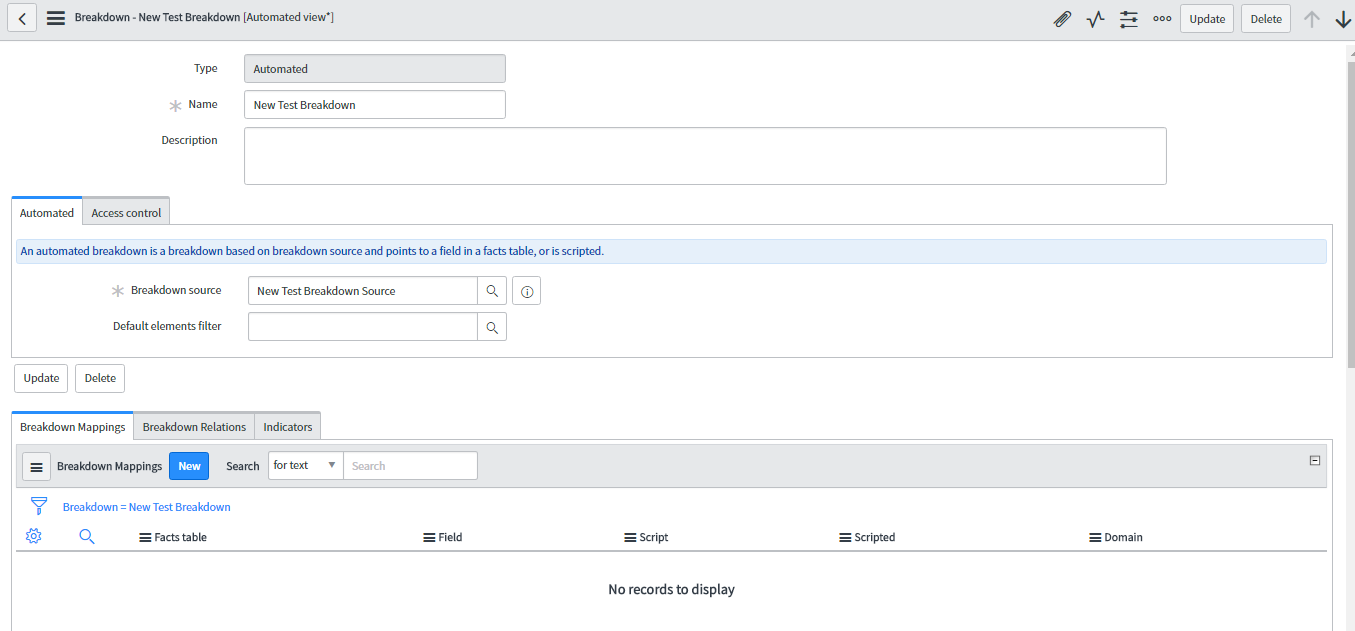
3) Breakdown: Breakdown allows us to group/filter indicator sources such as category/priority/assignment group etc., using breakdown sources.
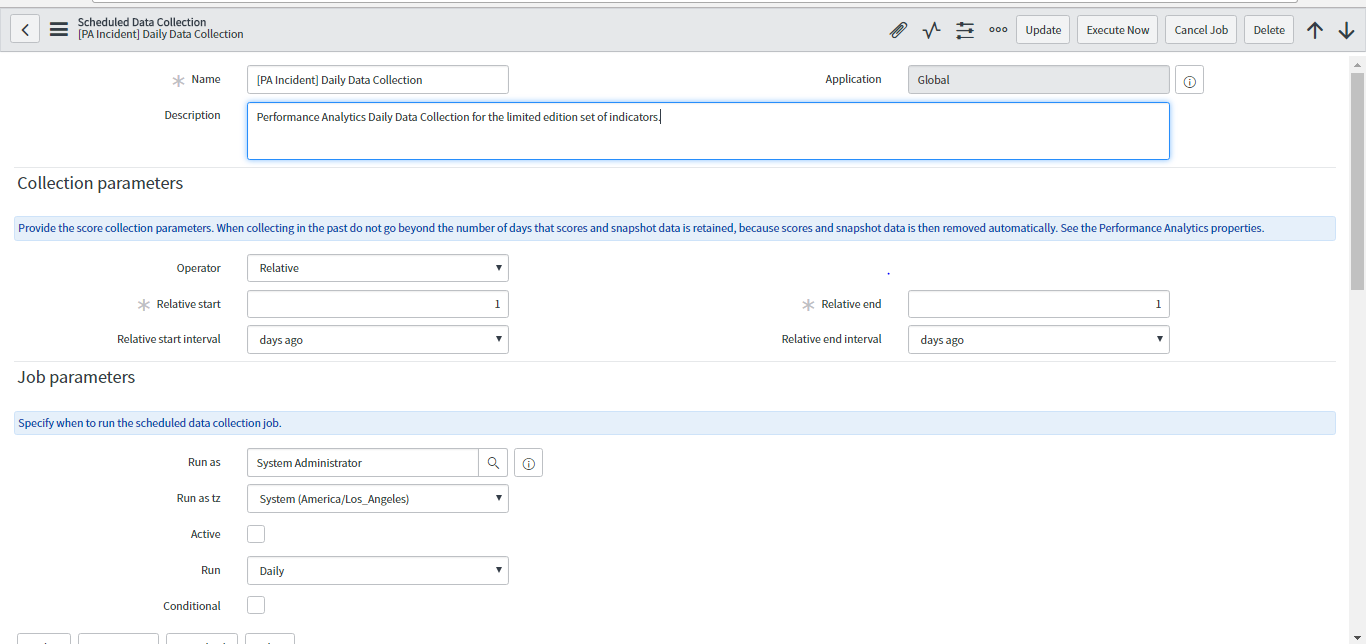
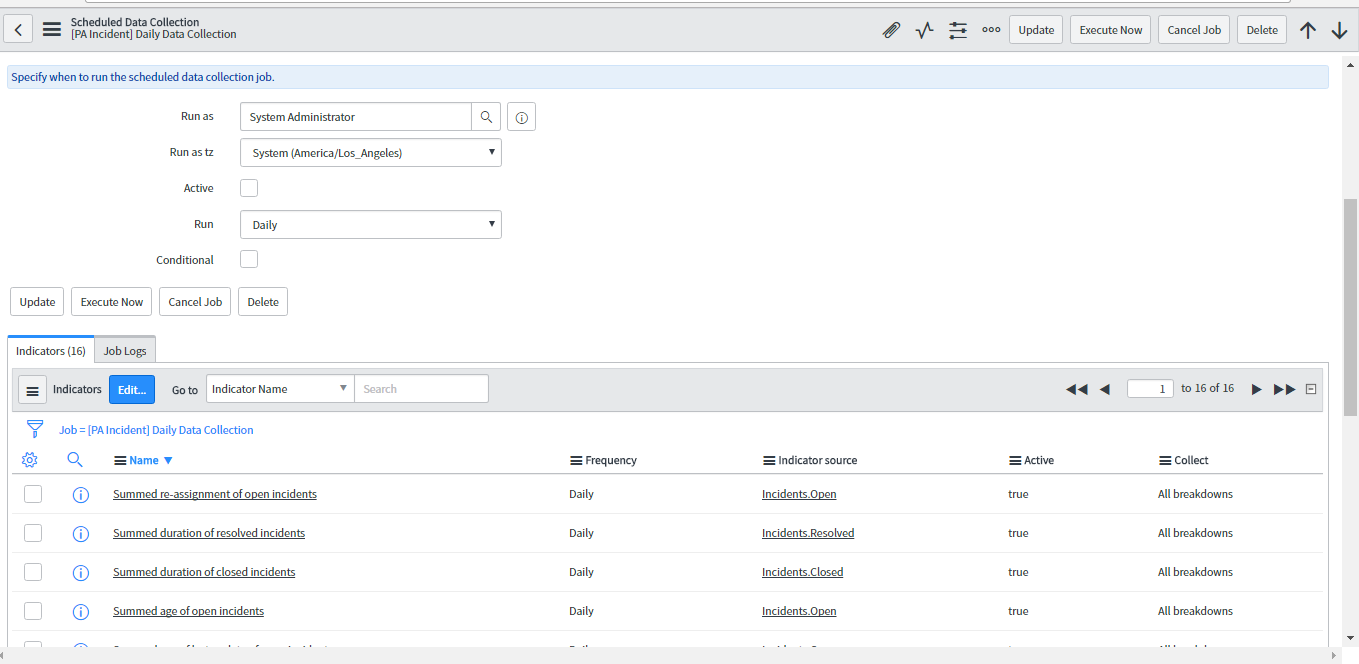
4) Data Collector: ServiceNow Performance Analytics uses scheduled jobs to collect and clean scores and snapshots and enables you to set or import scores manually. The user should run a historical data collection job to collect data for existing records.
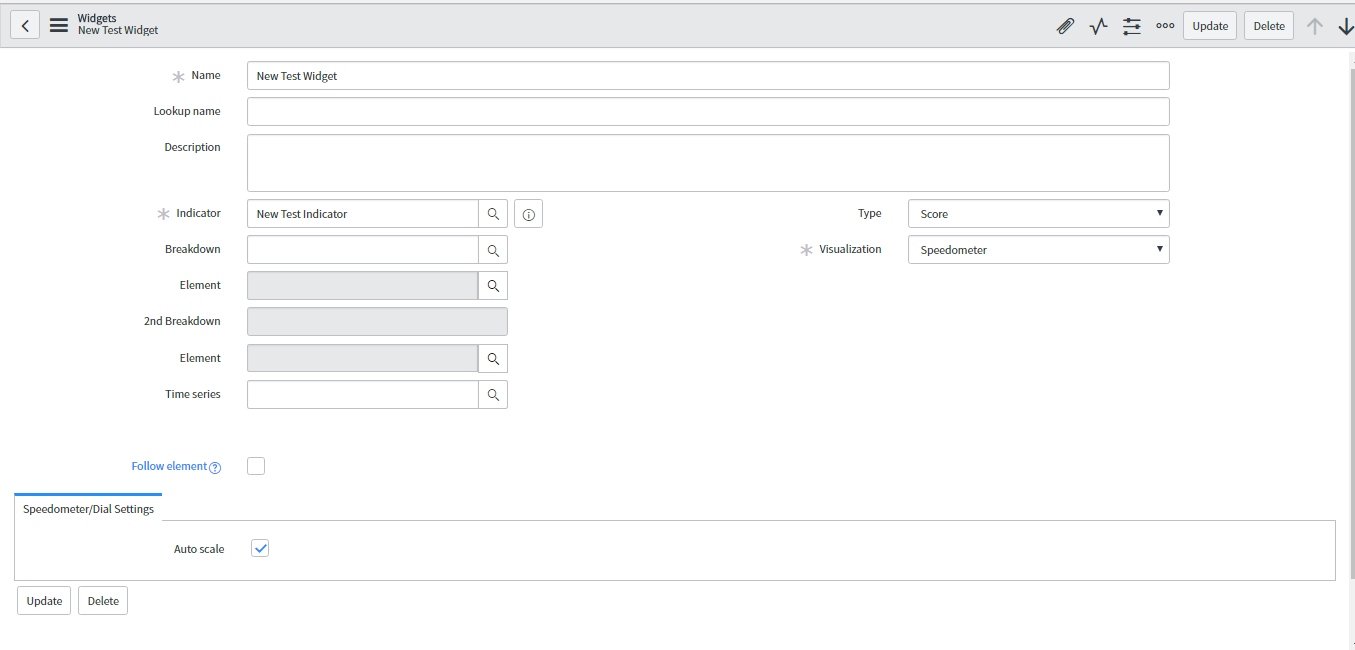
5) Widgets: To view, set up, and manage properties for dashboards and visualization types, Widgets can be used. Widgets are available on the dashboard.
Types of Widgets are:
- Time Series widget
- Breakdown Widget
- Score Widget
- Pivot Widget
- List Widget
- Text Analytics Widget
- Workbench Widget
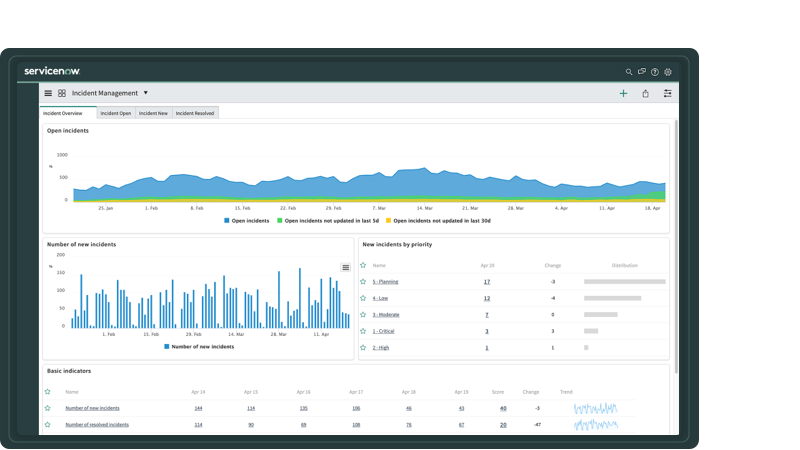
6) ServiceNow Reports and Dashboards: We can add multiple reports and ServiceNow Performance Analytics widgets in dashboards. Users with pa_admin and pa_power roles can only access dashboards.
Benefits of ServiceNow Performance Analytics
- ServiceNow Performance Analytics gives better insights and more clarity toward business goals.
- Helps businesses increase IT satisfaction.
- Performance Analytics enables us to keep track of data and use it efficiently over time.
- Maximize value by minimizing cost.
- Gives clear insights into whether an organization is lagging or is on track to the standards or goals set by the higher management
Why Jade’s ServiceNow Performance Analytics?
Jade leverages ServiceNow’s Performance Analytics for Security Operations to provide an easy-to-use, integrated application to report and analyze security operations performance and effectiveness.
Our configuration comes with over 60 predefined, best-practice KPIs and out-of-the-box dashboards to monitor security operations. The responsive, interactive canvas provides access to real-time trends with the flexibility to drill into performance results and answer questions on the spot.
Embedded and contextual analytics empower everyone to make better decisions, and a unique visualization library delivers end-to-end transparency within each process.
At Jade, Performance Analytics helps businesses identify business-critical issues, reduce response times, and reveal areas that can be automated to increase efficiency.
FOR MORE INFORMATION, REACH US AT Contact Us | Jade Global
Subscribe to our Technology Insights


About the Author

How Can We Help You?
Related Posts