If you haven’t heard about data visualization and business intelligence, now is the time to start learning! Business intelligence tools have been here for some time now. But as data continues to grow bigger and more businesses embrace digital marketing as the norm, advanced tools are now necessary for all companies.
BARC’s BI Trend Monitor had predicted the top business intelligence trends of 2021, to be data discovery and visualization, self-service BI, MD/DQ management, data governance, and a data-driven culture
Business Intelligence (BI) is the collective term for the technology and processes that allow users to access and analyze data in real time to make informed decisions. BI uses a variety of tools and platforms to allow users to draw meaningful conclusions from raw data, and ultimately help improve business decision-making.
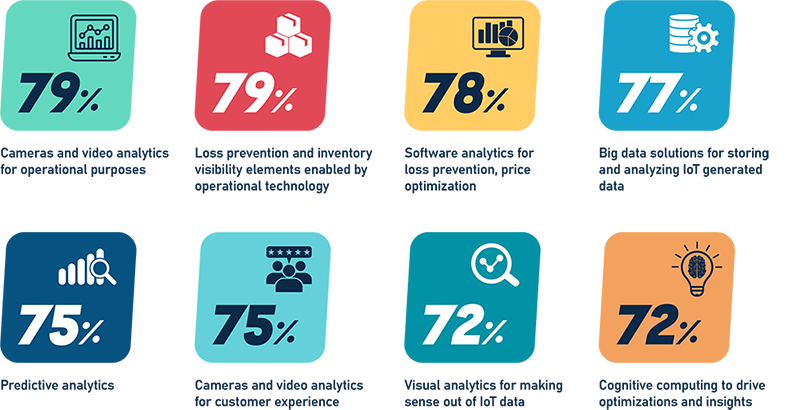
According to a Forbes study, businesses’ employment of BI Analytics tools is motivated by multiple objectives to varying degrees; from operations purposes, inventory visibility, to customer experience and deriving value from IoT, as illustrated below:
BI powered by analytics is the practice of using BI tools and platforms to achieve better insights into your organization's performance. It involves gathering, analyzing, and presenting data so you can answer questions such as:
What if we did X instead of Y?
How will Z impact our Q3 revenue?
How do I optimize my customer experience?
However, analytics tools that answer questions like these, that ultimately drive decisions, can be very complex and intimidating to use. With so many features available, it’s natural to feel lost when trying to understand how everything works together.
These come in different shapes and sizes – from free online dashboards that anyone can use, to complex enterprise solutions that cost thousands per user per month. Of course, there are dozens of solutions out there – but Power BI, Tableau, Looker are among the most widely used.
Jade Global's BI and Analytics Expertise can assist you in:
- Understanding which data visualization tools are the best fit for your company: PowerBI, Tableau or Looker.
- Creating or developing Business Intelligence Solutions to ensure that your company has the right blend of data sources, events, social media, internal data sets, etc., to support your business goals.
- Building the dashboard(s) you need to tell your company’s story in the way that is most accessible to everyone in your organization.
- Choosing the right consultant based on experience with BI technologies, the ability to help you meet your goals, and cost considerations.
Power BI vs Tableau vs Looker: we take a close look at the three leading data visualization tools and compare them across critical parameters to help you choose.
Which of these three BI and analytics tools is best for giving presentations, reports, and dashboards? How does the pricing compare and which of them most aligns to your planning and work style?
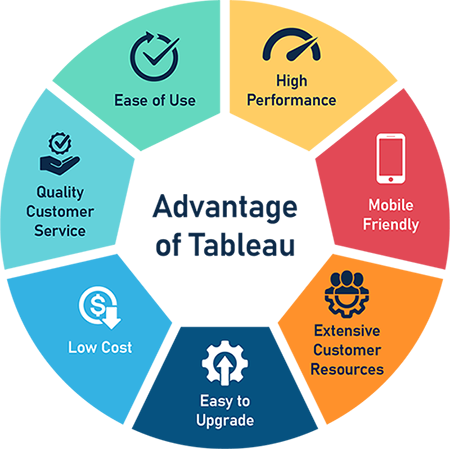
Tableau
Tableau is a user-friendly, intuitive tool for creating dashboards and visualizations. It is easy to get started with the tool since it has a drag-and-drop functionality that allows users to easily add data sources, tell the program how to analyze the data, and then add dimensions and measures.
It comes with several preconfigured templates that can be used as a starting point for building dashboards. This saves time because the templates already contain related data and filters for easy navigation.
Caters to a widespread business and global clientele
Tableau is designed for business users, marketing and sales teams and analysts rather than an IT department or developer.
If you need to check the progress of multiple clients on projects, you can use Tableau to help you collect and visualize data. This means it will make your business more effective and efficient at helping your customers, and in developing and improving upon products to meet demand. With no coding experience required, the software can be set up quickly and used remotely with cloud hosting. It comes in various forms and is a great asset for organizations that don't want having large software installed on-site.
A tiered pricing system
The first step to evaluating how much Tableau would cost you is to determine which of the three user types you would fall under. If you're a creator, your price will be determined by the number of data sources that you have. If you're an explorer or a viewer, then it will depend on the amount, and type, of data you plan on using.
Tableau allows for a near endless list of reliable data sources, which means you can always bring your own data to work without worrying about compatibility.
Ask any company that's used Tableau, and they'll tell you the same thing: It's easy to use, it's powerful, it makes you look smart, and it helps you solve real problems. That's because it's built on the principles of self-service analytics—and it's in active use by tens of thousands of companies worldwide.
Looker
Looker, built from the ground up on top of the world's fastest and most recent analytic databases, is a powerful tool that allows users to create interactive data visualization at lightning speed. Looker also provides customizable charting layouts for quickly building reports, so you save time.
Advantages of Looker
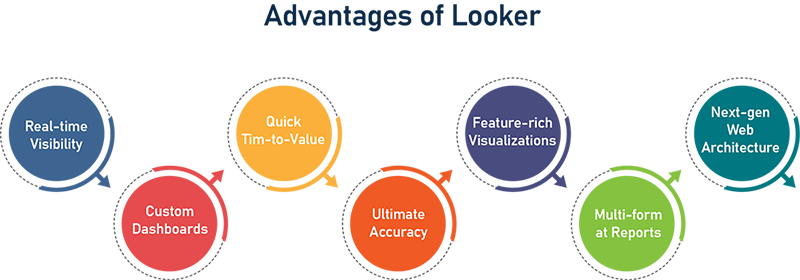
Get great insights with ease
Looker is a business intelligence tool formulated for teams across nearly all departments — from marketing to sales to finance. It is a good option for companies looking for a business intelligence software that is easy-to-use and affordable, and for those with less technical expertise. Looker BI provides a great foundation for all levels of users and allows individuals with no coding experience to build their own dashboards and reports.
It seamlessly integrates with more than 50 data sources listed with access to Amazon Redshift, Google BigQuery, Snowflake, Git and more.
A customised pricing plan
Looker has custom subscription plans that are designed to meet a variety of needs. From a simple pricing model with a few users to a more complex pricing model, it can be tailormade to request.
Power BI
Power BI is Microsoft’s answer to data visualization, and it’s incredibly powerful. Unlike many other tools, Power BI can handle large amounts of data. You can make reports and dashboards that are unique to your organization and keep them on your own servers.
It provides clarity on how an organization is performing, predicts future trends and helps users make better business decisions. From its inception, Power BI has been considered one of the best business intelligence tools available. It offers intuitive tools for high-quality data visualization, coupled with techniques to process large amounts of data in real-time.
Built for existing Microsoft users
It uses Microsoft’s cloud infrastructure. It’s a great choice for companies that already use the Office 365 suite in their work. Power BI works with Excel to build visualizations, so if you already have an Excel budget, you can add this to your list.
Power BI can import from a variety of sources, from Salesforce to Google Analytics to email marketing software. To get started, sign in and head over to 'Get Data.' Select what data you want to connect to Power BI and it'll automatically bring it over for you.
A price plan for everyone
Microsoft offers pricing for both individuals and companies as part of its Power BI tool. Microsoft offers free plans for those interested in trying the tool before deciding whether to subscribe. Power BI’s price point is considered relatively lower and more flexible than many other tools today.
A feature comparison: Power BI vs Tableau vs Looker
| Feature | Tableau | Looker | Power BI |
|---|---|---|---|
| Data Volume | Tableau can handle huge volumes of data with a columnar data model that dynamically creates smaller data sets when needed. This allows for larger datasets to be analyzed within the tool, which opens the potential for analyses involving a lot of data. | To keep performance fast and data accurate, the number of rows in any Looker query created via the Explore page is restricted to 5,000 rows. | Each Power BI user is allowed 10 GB of storage per user, but in case of a larger dataset, users can directly access an external database or cloud, to access and analyze it. |
| Implementation | Cloud and On-prem | Cloud and On-prem | Browser-based |
| Visualization Selection | Tableau offers a wide range of visualizations. The Visualization pane allows you to create charts and tables from your data and interact with it, which is very intuitive. Tableau integrates with the rest of your technology stack, so you can share insights with anyone on any device. | Visualize data, explore relationships, and uncover insights with Looker's extensive visualization capabilities. Any Looker user can easily create custom visualizations that best fit the needs of their team. This is made even more powerful with Looker's real time query capability. | Power BI comes with about 3500 data points and an array of visualizations to choose from. The combination gives some great possibilities for making connections that can help you achieve your business goals in various ways. |
| Integration Possibilities | It continually expands its integration framework and set of APIs. With Tableau, you can combine the world's most popular data visualization and data analytics tool with hundreds of 3rd party applications | Looker’s highly scalable infrastructure and open API allow for seamless data integration with external systems. Looker Blocks feature simplifies the process by embedding pre-built, ready-to-use code in a variety of applications such as Google Docs, Excel, and a lot of third-party apps. | It easily integrates with other analytical tools. It has API access to multiple cloud applications, including Salesforce and Google Analytics, as well as a sophisticated visualization tool set. |
Our Verdict
Power BI is a remarkable tool for building dashboards, reports, and visualizations. It integrates with all Microsoft products including Office365. Its drag and drop functionality and interaction with the Office365 systems make it a viable option for those working in the Microsoft ecosystem.
Tableau is feature-rich, offering a lot more than other tools in the market today, its powerful and easy interface makes it a winner among data analysts. It focuses on granular visualization of data and helps create sensational looking dashboards.
With Looker, a broad array of users run a single query on a complete semantic model resulting in a single source of truth for the enterprise. It offers the data discovery capabilities businesses need, coupled with all the automation and engagement tools your marketing & sales teams use every day.
Choose the best tool for your business with Jade Global
Jade Global's BI Analytics Experts have helped many companies with their Data and Business Intelligence needs. We have a team of Analytics Experts, Business Intelligence Consultants who can help you determine the best tool for your business.
By leveraging our experience in working with different data sources, we can help you make the right decision to get the most value from your investment.
We guide you all the way from initial project scoping to final delivery. With our end-to-end data modernization services, we walk with you through all aspects of your project – from data prep to reporting – saving you time and money applying our gamut of services like Advisory and Consulting, Implementation and Migration, Strategic Services, and Managed Services.
Request for services
Find out more about how we can help your organization navigate its next. Let us know your areas of interest so that we can serve you better.