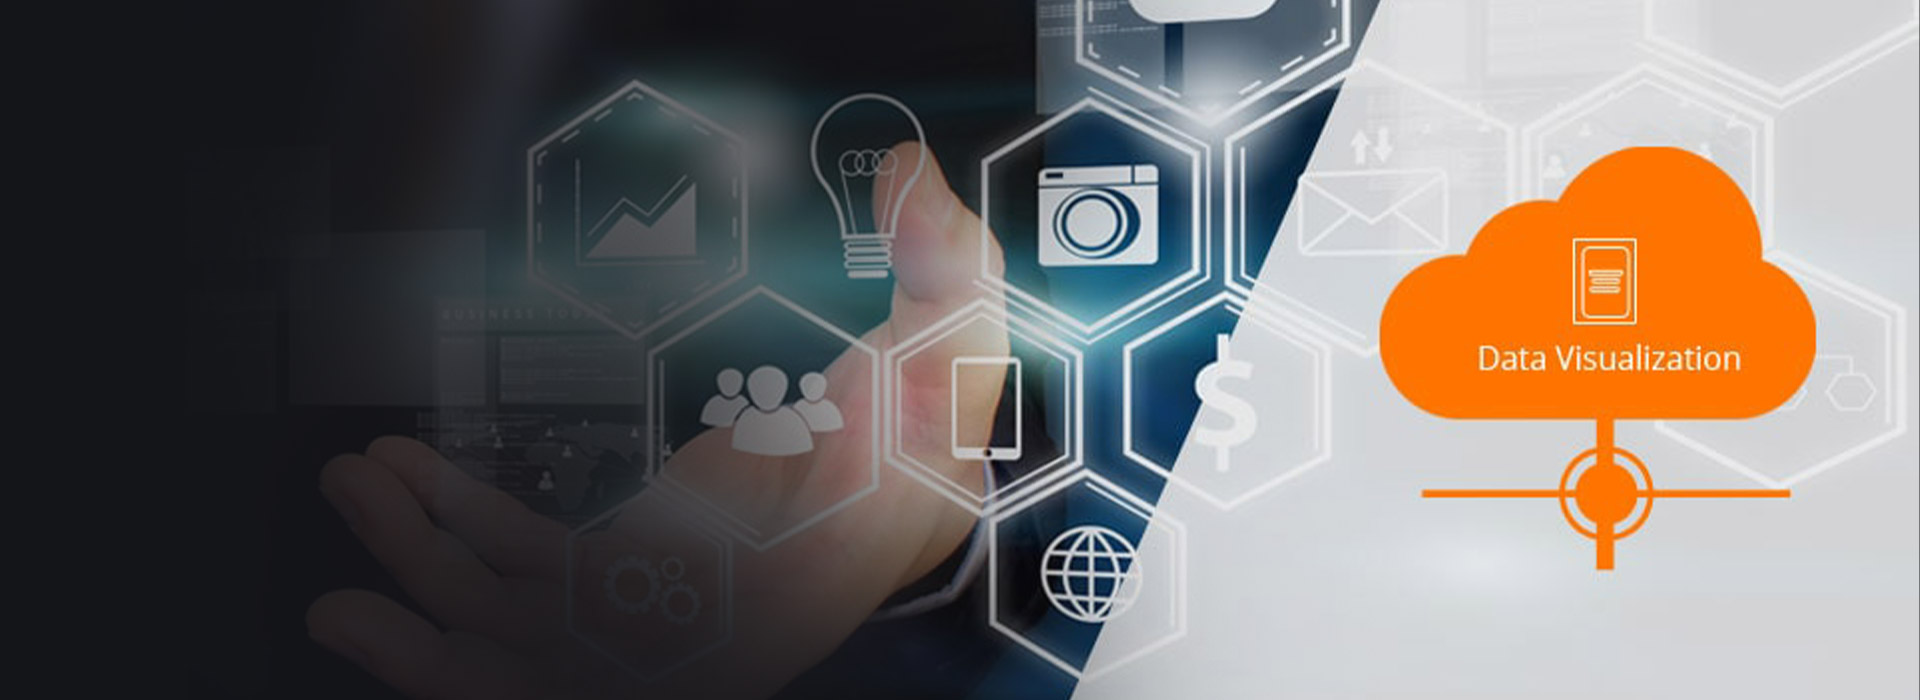
Data Visualization – Now in the Cloud!
Jade Consultancy Team
Jul 19, 2017
Visual Data is the more useful. Oracle’s Data Visualization Cloud Service (DVCS) is a new and advanced Oracle Cloud Service made available in November 2015. It is a web-based tool that enables you to explore analytical data visually and on an individual basis. It is Oracle’s cloud version of the Visual Analyzer (VA), a central part of the Business Intelligence Cloud Service (BICS). The simplicity of DVCS makes it easy to visualize your data in a wide range of formats. You can look at your data in a specific way that makes the most sense for you.
Highlights Include:
- Simple Setup:
DVCS is simple to procure and use, with a quick setup process. Just upload your Excel spreadsheets with your data, and DVCS will start visualizing the data with the Visual Analyzer (VA). Multiple spreadsheets can be uploaded to blend data and bring in multiple data sets. Select the elements you are interested in, and let Oracle’s Data Visualization Cloud Service find the best way to visualize it. - The Visual Experience
Visualizing your data in DVCS is easy. The best visualizations display automatically, and hence no modeling or configuration is required. Related data is automatically connected, so when you highlight data in one visual, it highlights correlated data in every other visual, revealing patterns and new insights. DVCS makes it easy to visualize your data so you can focus on exploring these interesting patterns and outliers. Along with auto visualization is brushing and intuitive filtering. Sophisticated filtering in DVCS makes it easy to find and share insights. Other powerful visualization features include auto coloring and built in maps.
- Anyone can Use It
Once your data files from Excel are uploaded, anyone can use it without needing to get the IT department involved. Eric Jacobsen of Oracle Corporate explains, “With DVCS, any user can blend and visually analyze data from all relevant sources in just a few clicks, and quickly uncover and share hidden patterns and actionable insights. All of this can be done without the need for expert IT resources, resulting in faster time to value and significant increases in ROI” in his December 2, 2015 blog post. - Share with Anyone
With DVCS, you can share insights with one or many other people. You have the option of private analysis, where you only share data with specific individuals, or the option of sharing with a team. - Use it Anywhere
DVCS can be used anywhere. Its responsive interface works on both tablets and smartphones. This portability between devices makes DVCS perfect for sharing and checking your reports on the go.
It is obvious that Data Visualization is an important new area of emphasis for Oracle. As more business applications move into the cloud, business intelligence and analytics applications will naturally follow. If data originates in the cloud, it makes sense to analyze it there, too,” explains David Carr, an Account Manager at Oracle in his article Data Visualization: Better in the Cloud? More than most of its competitors, Oracle has made a point of saying it will deliver the same technology in the cloud and as traditional enterprise software to maximize portability between the two.
DVCS Tablet Display: 
Subscribe to our email Newsletter
Popular Posts


About the Author

How Can We Help You?
Related Posts